


Statistical methods are the backbone of rigorous empirical research across various disciplines. This blog post seeks to demystify the concept of descriptive statistics, providing a detailed analysis of its role in data interpretation and emphasizing its practical implementation across a multitude of fields. By exploring the fundamental components, readers should expect to gain a comprehensive understanding of how descriptive statistics serve as a tool for summarization and simplification in an increasingly data-driven world.
The significance of statistics in research cannot be overstated, as it is often through the application of these methods that complex data becomes interpretable and insightful. Our discussion will introduce these principles and prepare the ground for deeper exploration throughout this blog.
Understanding Descriptive Statistics
Definition and purpose of descriptive statistics
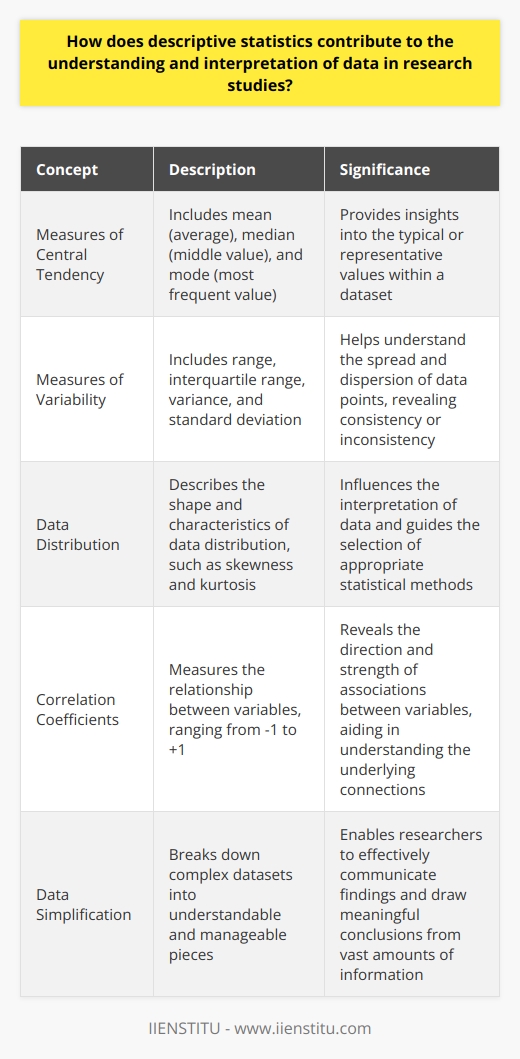
Descriptive statistics form the cornerstone of quantitative analysis, offering a snapshot of data by producing concise summaries. The intrinsic value of these statistical methods lies in their ability to simplify complex datasets, allowing for a more digestible presentation of research findings. Problem solving skills course frequently emphasize the ability to comprehend and apply these techniques effectively. Despite their essential role, it is imperative to recognize the limitations of descriptive statistics, which are often misunderstood as providing inferential judgements when they simply describe a set.
Benefits of using descriptive statistics
The utility of descriptive statistics extends to numerous aspects of data analysis - from providing a foundational understanding of the dataset’s shape to aiding in detecting errors or anomalies. These statistical tools allow researchers to convey their findings in a manner that is both accessible and informative to a range of audiences, regardless of their prior statistical knowledge.
Acknowledging limitations in its use
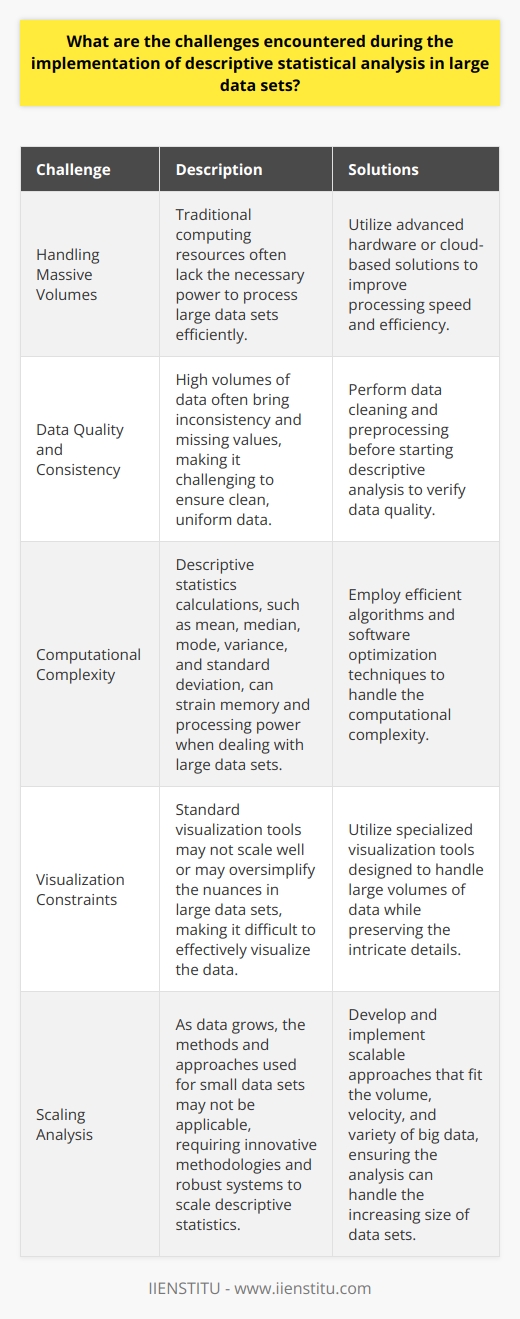
However, descriptive statistics are not without their constraints. They provide a summarized glimpse but may obfuscate the nuances and underlying patterns present within the data. It is essential to use these methods as part of a broader analytical strategy, ensuring that the interpretation of data does not halt at the descriptive level, but extends to more complex analyses where appropriate.
Fundamental Components of Descriptive Statistics
Measures of Central Tendency
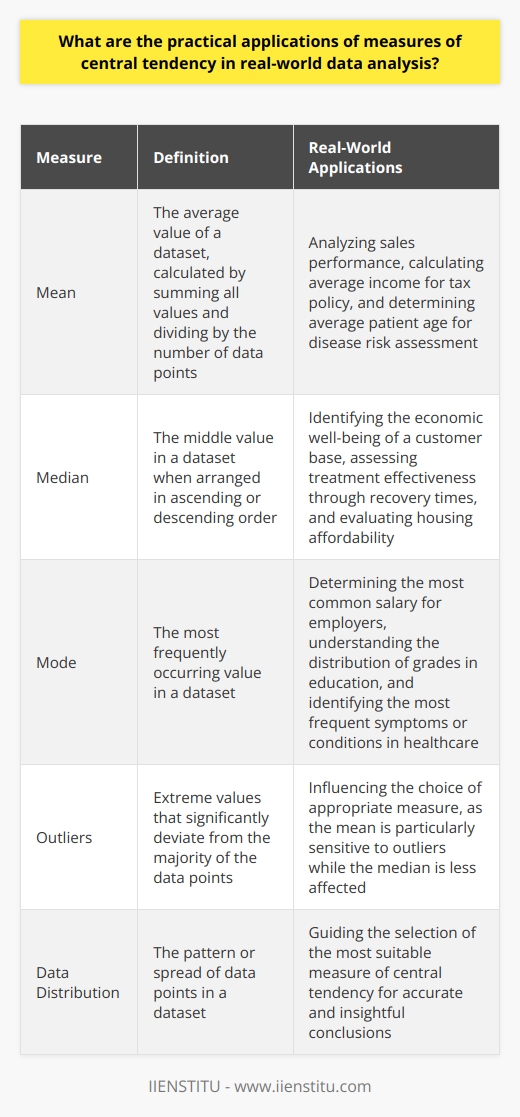
Grasping the concept of central tendency is fundamental when engaging with descriptive statistics. This involves understanding measures such as mean, median, and mode, each offering a unique lens through which to view the "center" of the data. The mean calculates the average value which can be influenced by outliers, while the median provides the middle value when data are ranked, proving robust against skewed distributions. The mode, identifying the most frequent value, offers insight into the data's modality.
Calculating these measures and interpreting results
Computing these measures may seem straightforward, but interpreting them requires a discerning eye. It is through careful comparison and analysis of these measures that one can infer the data’s symmetry, skewness, and even identify outlier effects. Online certificate courses often include training on utilizing software for these calculations, though understanding their implications is just as critical.
Real-life examples for better understanding
Consider a classroom where students' test scores could be analyzed to evaluate performance. The mean score would provide an average performance metric, the median can represent a typical score unaffected by extreme grades, and the mode can highlight the most common score bracket. Such analysis assists in curriculum adjustments and targeted educational interventions.
The Role of Graphs and Charts in Descriptive Statistics
Importance of visual representation
Visualizing data is a powerful aspect of descriptive statistics, translating numerical findings into imagery that can be rapidly interpreted. Graphs and charts provide a narrative to the data, effectively communicating results and revealing trends that might go unnoticed in tabular data. Different data calls for different types of visual tools, making it imperative to choose the appropriate format when conveying statistical information.
Advantage of using graphs and charts
The effectiveness of data representation can significantly affect the audience's comprehension. A well-designed chart can facilitate comparison, highlight statistical relationships, and become an integral part of storytelling with data. The decision to use a bar chart over a line graph, for example, could make the difference in how successfully the data's message is communicated.
Type of data suitable for different graphs
Selecting the correct graph or chart is closely related to the type of data at hand. For categorical data, pie charts can effectively showcase proportions, whereas histograms are suitable for continuous data, revealing distribution patterns. Time-series data would benefit from a line graph, highlighting trends over a period, while scatter plots are ideal for examining the relationship between two quantitative variables.
Practical Application of Descriptive Statistics
Use of descriptive statistics in various industries
Descriptive statistics find applications in virtually every industry, affecting decision-making processes and strategy formulation. In business, these statistics can illustrate sales trends, customer demographics, or performance measures. The healthcare sector relies on descriptive analyses to track disease prevalence or patient outcomes. Social scientists use descriptive statistics to map patterns in social behavior, while psychologists could use them to summarize survey data.
Application in business and finance
For example, a retail store might apply descriptive statistics to identify the average customer spend or to determine the most popular product categories during different seasons. By leveraging these insights, a store can optimize its inventory, tailor marketing strategies, and improve overall operational efficiency.
Relevance in health and medical research
In the medical field, descriptive statistics can summarize patient blood pressure readings in a research study, offering a straightforward depiction of the study population's cardiovascular health status. It allows for an initial assessment before delving into more sophisticated statistical tests that might compare the efficacy of different treatments.
Conclusion
Recap of importance and application of descriptive statistics
Descriptive statistics act as interpreters in a world saturated with data. They serve an indispensable role in research and decision-making by providing clear, concise summaries of data. This blog has covered the importance and application of these statistics, from the computation of central measures to the visual impact of graphs and charts.
Encouragement for further study and usage
As with any scientific method, the journey of learning and applying descriptive statistics is ongoing. Researchers, students, and professionals across industries are encouraged to further their understanding of these methods, recognizing their value and potential when combined with other forms of data analysis.
Concluding thoughts on the power and limitations of descriptive statistics
While powerful, descriptive statistics provide the foundation upon which further, more complex analysis can be built. An awareness of their limitations is just as critical as recognizing their utility. By appreciating the nuances of descriptive statistics and the insights they can offer, users can contribute to a more informed, data-driven approach in their respective fields.