In our fast-paced, data-driven world, the ability to effectively analyze and interpret data has become a crucial skill across industries. From healthcare and finance to marketing and beyond, data analysis is transforming the way organizations make decisions and drive growth. As someone who has witnessed the evolution of data analysis firsthand, I can attest to its profound impact on strategic decision-making processes.
Data analysis has profoundly impacted strategic decision-making processes.
It empowers individuals and organizations by providing tools to inspect, cleanse, transform, and model data, leading to informed decision-making.
Descriptive Analysis summarizes historical data, while Diagnostic Analysis probes deeper to determine causation or correlations.
Predictive Analysis forecasts future events using historical data, while Prescriptive Analysis determines the best course of action in a given situation.
Advancements in data analysis include the emergence of AI and machine learning, allowing for real-time data processing and complex algorithmic predictions.
Data analysis stages include Data Collection, which is critical for the integrity of the analysis, and Data Cleaning, which involves identifying and correcting errors or omissions in the data.
When I first started my career in marketing, data analysis was still in its infancy. We relied heavily on gut instincts and past experiences to guide our decisions. However, as technology advanced and data became more accessible, I quickly realized the power of data-driven insights. I remember the first time I used data analysis to optimize a marketing campaign. By analyzing customer behavior and preferences, we were able to create targeted messages that resonated with our audience, resulting in a significant increase in conversions and ROI.
Over the years, I have seen data analysis evolve from a niche skill to a fundamental requirement for success in almost every field. Today, organizations that fail to leverage data in their decision-making processes risk falling behind their competitors. As John W. Tukey, a pioneer in the field of data analysis, once said, "The greatest value of a picture is when it forces us to notice what we never expected to see" (Tukey, 1977, p. vi). Data analysis allows us to uncover hidden insights and challenge our assumptions, leading to more informed and effective decisions.
Types of Data Analysis Explained
To fully understand the impact of data analysis on decision-making, it is essential to grasp the different types of data analysis and their applications. Let's take a closer look at each type:
1- Descriptive Analysis: This type of analysis focuses on summarizing historical data to provide a clear picture of what has happened in the past. It involves using statistical tools to calculate measures such as mean, median, and mode, as well as creating visualizations like charts and graphs. Descriptive analysis is often the first step in the data analysis process, as it helps identify patterns and trends that can guide further investigation.
2- Diagnostic Analysis: Building upon the insights gained from descriptive analysis, diagnostic analysis aims to determine the root causes behind observed trends or issues. It involves drilling down into the data to identify correlations and causal relationships. For example, if a company experiences a sudden drop in sales, diagnostic analysis can help pinpoint the specific factors contributing to the decline, such as changes in customer preferences or market conditions.
3- Predictive Analysis: As the name suggests, predictive analysis uses historical data to forecast future events or outcomes. By applying statistical models and machine learning algorithms to past data, analysts can identify patterns and trends that are likely to continue in the future. This type of analysis is particularly valuable for businesses looking to make data-driven decisions about inventory management, resource allocation, and customer behavior.
4- Prescriptive Analysis: Taking predictive analysis a step further, prescriptive analysis provides recommendations for the best course of action based on the insights gained from historical data and future projections. It involves using optimization techniques and simulation models to evaluate different scenarios and determine the most effective strategy. For example, prescriptive analysis can help a company determine the optimal pricing strategy for a new product based on factors such as production costs, market demand, and competitor pricing.
How to Clean Data for Analysis
One of the most critical stages in the data analysis process is data cleaning. As the saying goes, "garbage in, garbage out." If the data used for analysis is incomplete, inaccurate, or inconsistent, the insights gained from the analysis will be flawed. Therefore, it is essential to take the time to clean and prepare data before beginning any analysis.
The first step in data cleaning is to identify and remove any duplicates or irrelevant data points. This can be done using various tools and techniques, such as Excel's "Remove Duplicates" function or SQL's "DISTINCT" keyword. Next, analysts must address missing or incomplete data. Depending on the nature of the data and the analysis being performed, missing values can be handled in different ways, such as removing the entire record, imputing the missing value based on other data points, or creating a separate category for missing data.
Inconsistencies in data formatting and structure can also pose challenges for analysis. For example, if a dataset contains both numerical and categorical variables, it may be necessary to convert the categorical variables into numerical ones using techniques like one-hot encoding. Additionally, outliers and extreme values should be identified and handled appropriately, as they can skew the results of the analysis.
While data cleaning can be a tedious and time-consuming process, it is essential for ensuring the accuracy and reliability of the insights gained from data analysis. As Hadley Wickham, a prominent data scientist and creator of the tidyverse package in R, notes, "Tidy datasets are all alike, but every messy dataset is messy in its own way" (Wickham, 2014, p. 4). By taking the time to clean and prepare data upfront, analysts can avoid the pitfalls of messy data and ensure that their insights are based on a solid foundation.
Predictive Analytics in Business Strategies
One of the most exciting applications of data analysis is predictive analytics. By leveraging historical data and machine learning algorithms, companies can gain valuable insights into future trends and behaviors, allowing them to make proactive decisions that drive growth and profitability.
For example, in the retail industry, predictive analytics can be used to forecast demand for specific products based on factors such as past sales data, customer demographics, and seasonal trends. Armed with this information, retailers can optimize their inventory levels, reducing the risk of stockouts or overstocking. Additionally, predictive analytics can be used to personalize marketing efforts, targeting customers with relevant offers and promotions based on their past purchase history and preferences.
In the financial sector, predictive analytics is used to assess credit risk, detect fraudulent activities, and optimize investment portfolios. By analyzing vast amounts of data on borrowers' financial histories and behaviors, lenders can develop more accurate credit scoring models that reduce the risk of default. Similarly, by analyzing market trends and historical performance data, investment firms can develop predictive models that help identify promising investment opportunities and minimize risk.
The healthcare industry is another area where predictive analytics is having a significant impact. By analyzing patient data, including medical history, genetic information, and lifestyle factors, healthcare providers can identify individuals at high risk for certain diseases and develop targeted prevention and treatment plans. Predictive analytics can also be used to optimize hospital staffing levels based on anticipated patient volumes and acuity levels, improving both patient outcomes and operational efficiency.
As Eckerson (2007) notes in his book "Predictive Analytics: Extending the Value of Your Data Warehousing Investment," "predictive analytics is about looking ahead and anticipating outcomes and behaviors based upon the relationships among variables that have been discovered through data mining" (p. 5). By leveraging the power of predictive analytics, businesses can gain a competitive edge and make more informed, data-driven decisions that drive success.
Prescriptive Analysis vs. Predictive Analysis
While predictive analysis and prescriptive analysis are both valuable tools for data-driven decision-making, they serve different purposes and provide different types of insights. Predictive analysis, as discussed earlier, focuses on forecasting future events or outcomes based on historical data and statistical models. It answers the question, "What is likely to happen?"
On the other hand, prescriptive analysis takes the insights gained from predictive analysis and goes a step further by providing recommendations for the best course of action based on those insights. It answers the question, "What should we do?" Prescriptive analysis involves using optimization techniques and simulation models to evaluate different scenarios and determine the most effective strategy for achieving a specific goal.
For example, let's say a company uses predictive analysis to forecast demand for a new product based on market trends and customer data. The analysis suggests that there will be high demand for the product in certain geographic regions and among specific demographic groups. Prescriptive analysis can then be used to determine the optimal pricing strategy, production levels, and distribution channels to maximize profitability and meet the anticipated demand.
In the healthcare industry, prescriptive analysis can be used to optimize treatment plans for individual patients based on their specific health conditions, genetic factors, and lifestyle habits. By analyzing data on patient outcomes and treatment effectiveness, healthcare providers can develop personalized treatment recommendations that are tailored to each patient's unique needs and circumstances.
While predictive analysis provides valuable insights into what is likely to happen in the future, prescriptive analysis takes those insights a step further by providing actionable recommendations for how to optimize outcomes. As Runkler (2020) notes in his book "Data Analytics: Models and Algorithms for Intelligent Data Analysis," "prescriptive analytics aims to find the best possible action in a given scenario" (p. 6). By combining the power of predictive and prescriptive analysis, organizations can make more informed, data-driven decisions that drive success and optimize outcomes.
Importance of Data Collection Methods
The quality and accuracy of the insights gained from data analysis are only as good as the data itself. Therefore, the importance of effective data collection methods cannot be overstated. The choice of data collection method will depend on the specific research question or business problem being addressed, as well as the resources available and the characteristics of the population being studied.
One of the most common data collection methods is surveys. Surveys can be conducted online, by phone, or in person, and they allow researchers to gather information from a large number of individuals quickly and efficiently. However, surveys are subject to various biases, such as response bias and selection bias, which can impact the accuracy of the data collected. To minimize these biases, researchers must carefully design their survey questions and sampling methods to ensure that the data collected is representative of the population being studied.
Another important data collection method is observation. Observation involves systematically watching and recording behavior, events, or processes in their natural setting. This method is particularly useful for studying complex social phenomena or behaviors that are difficult to measure through surveys or other methods. However, observation can be time-consuming and subject to observer bias, which occurs when the researcher's own perceptions and interpretations influence the data collected. To minimize observer bias, researchers must establish clear protocols for data collection and analysis and use multiple observers to cross-validate their findings.
Experiments are another valuable data collection method, particularly in fields such as psychology and medicine. Experiments involve manipulating one or more variables to observe their effect on a specific outcome, while controlling for other variables that may influence the results. Experiments allow researchers to establish causal relationships between variables and test specific hypotheses. However, experiments can be expensive and time-consuming to conduct, and they may not always be feasible or ethical, particularly when studying human subjects.
Finally, secondary data analysis involves using data that has already been collected by other researchers or organizations for different purposes. This method can be a cost-effective and efficient way to gather data, particularly when studying large populations or historical trends. However, secondary data may not always be suitable for the specific research question being addressed, and researchers must carefully evaluate the quality and relevance of the data before using it in their analysis.
Effective data collection is essential for ensuring the accuracy and reliability of the insights gained from data analysis. As Kabacoff (2015) notes in his book "R in Action: Data Analysis and Graphics with R," "the quality of your data determines the quality of your analyses and models" (p. 37). By carefully selecting and implementing appropriate data collection methods, researchers and analysts can ensure that their data is of high quality and suitable for the specific research question or business problem being addressed.
Ethical Considerations in Data Analysis
As data analysis becomes increasingly sophisticated and ubiquitous, it is essential to consider the ethical implications of collecting, analyzing, and using data. While data analysis has the potential to drive innovation and improve decision-making, it also raises important questions about privacy, fairness, and transparency.
One of the most pressing ethical concerns in data analysis is data privacy. As organizations collect and analyze vast amounts of personal data, there is a risk that this data could be misused or disclosed without the individual's consent. To mitigate this risk, organizations must implement robust data security measures and adhere to strict data privacy regulations, such as the European Union's General Data Protection Regulation (GDPR) and the California Consumer Privacy Act (CCPA).
Another important ethical consideration in data analysis is algorithmic bias. Algorithmic bias occurs when the data used to train machine learning models reflects societal biases and prejudices, leading to discriminatory outcomes. For example, if a hiring algorithm is trained on data that reflects historical gender and racial biases in hiring decisions, it may perpetuate those biases in future hiring decisions. To address algorithmic bias, organizations must carefully evaluate the data used to train their models and implement measures to detect and mitigate bias.
Transparency and explainability are also critical ethical considerations in data analysis. As machine learning models become more complex and opaque, it can be difficult for individuals to understand how decisions are being made about them. This lack of transparency can erode trust in the organizations that use these models and raise concerns about fairness and accountability. To address these concerns, organizations must strive to make their models more transparent and explainable, providing clear information about how decisions are being made and allowing individuals to challenge those decisions when necessary.
Finally, the use of data analysis for surveillance and profiling raises important ethical concerns. While data analysis can be a powerful tool for identifying patterns and trends, it can also be used to monitor and track individuals without their knowledge or consent. This type of surveillance can have a chilling effect on free speech and civil liberties, particularly when used by governments or law enforcement agencies. To mitigate these risks, organizations must carefully evaluate the ethical implications of their data analysis practices and implement safeguards to protect individual privacy and civil liberties.
As O'Neil (2016) argues in her book "Weapons of Math Destruction: How Big Data Increases Inequality and Threatens Democracy," "we must come together to police these weapons of math destruction, to tame and disarm them" (p. 25). By carefully considering the ethical implications of data analysis and implementing measures to ensure fairness, transparency, and accountability, organizations can harness the power of data while respecting individual rights and promoting the greater good.
Data Visualization Techniques for Beginners
Data visualization is a critical component of data analysis, allowing analysts to communicate complex insights in a clear and compelling way. Effective data visualization can help stakeholders quickly grasp key trends and patterns, making it easier to make data-driven decisions. However, for beginners, the process of creating effective data visualizations can be overwhelming. Here are some key techniques and best practices to keep in mind:
1- Choose the right chart type: The first step in creating effective data visualizations is to choose the right chart type for the data being presented. Different chart types are better suited for different types of data and insights. For example, bar charts are useful for comparing categorical data, while line charts are better for showing trends over time. Pie charts can be effective for showing the composition of a whole, but they should be used sparingly and only when the number of categories is small.
2- Keep it simple: One of the most common mistakes beginners make when creating data visualizations is trying to include too much information in a single chart. This can make the chart cluttered and difficult to interpret. Instead, aim to keep your visualizations simple and focused, highlighting only the most important insights. Use clear labels and legends to help viewers understand what the chart is showing, and avoid using too many colors or visual elements that can distract from the main message.
3- Use color effectively: Color is a powerful tool in data visualization, but it must be used carefully to avoid confusion or misinterpretation. When using color to represent different categories or values, choose a color scheme that is easy to distinguish and interpret. Avoid using too many colors, as this can make the chart difficult to read. Additionally, be mindful of color blindness and ensure that your visualizations are accessible to all viewers.
4- Pay attention to scale: The scale of your visualization can have a significant impact on how the data is interpreted. When creating charts with numerical axes, be sure to choose a scale that accurately represents the data and avoids distorting the insights. For example, if the data range is very small, using a scale that starts at zero can make the differences between values appear larger than they actually are. On the other hand, if the data range is very large, using a logarithmic scale can help to make the differences between values more visible.
5- Tell a story: Finally, remember that the purpose of data visualization is to communicate insights and tell a story. When creating visualizations, think about the key message you want to convey and how the data supports that message. Use clear titles and annotations to guide the viewer through the visualization and highlight the most important insights. Consider the audience for your visualization and tailor the design and messaging accordingly.
As Knaflic (2015) notes in her book "Storytelling with Data: A Data Visualization Guide for Business Professionals," "the goal with data visualization is to use data to inform and to inspire action" (p. 12). By following these best practices and techniques, beginners can create effective data visualizations that communicate insights clearly and compellingly, driving better decision-making and action.
Real-World Applications of Data Analysis
Data analysis has become an integral part of decision-making in virtually every industry and sector. Here are just a few examples of how data analysis is being used to drive innovation and improve outcomes in the real world:
1- Healthcare: Data analysis is transforming the healthcare industry, enabling providers to deliver more personalized and effective care. For example, by analyzing patient data from electronic health records, wearable devices, and other sources, providers can identify individuals at high risk for certain diseases and develop targeted prevention and treatment plans. Additionally, data analysis can be used to optimize hospital staffing levels, reduce readmission rates, and improve patient outcomes.
2- Retail: In the retail industry, data analysis is being used to optimize supply chain management, personalize marketing efforts, and improve the customer experience. By analyzing data on customer behavior and preferences, retailers can develop targeted marketing campaigns and product recommendations that drive sales and loyalty. Additionally, data analysis can be used to optimize inventory levels and pricing strategies, reducing waste and maximizing profitability.
3- Finance: Data analysis is critical for risk management and fraud detection in the financial industry. By analyzing vast amounts of data on financial transactions and market trends, financial institutions can identify potential risks and fraudulent activities early on, allowing them to take proactive measures to mitigate losses. Additionally, data analysis is being used to develop more accurate credit scoring models and optimize investment portfol
Frequently Asked Questions
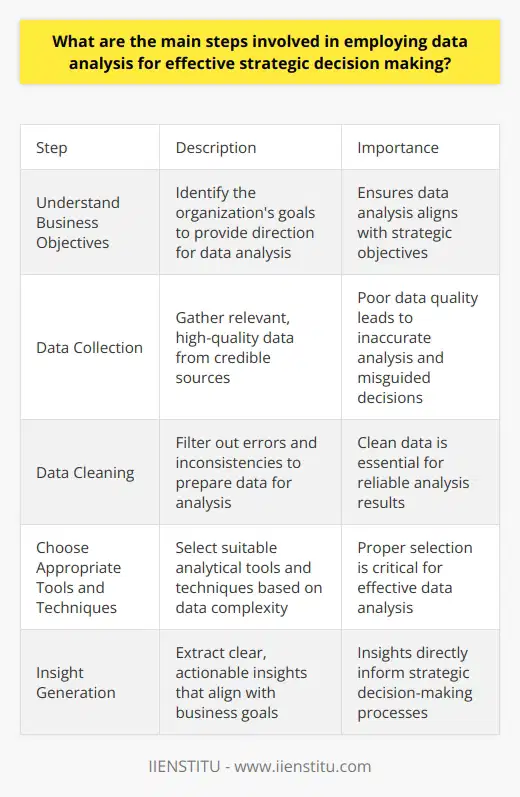
What are the main steps involved in employing data analysis for effective strategic decision making?
Data analysis plays a crucial role in strategic decision-making. It transforms raw data into actionable insights. Leaders leverage these insights to make informed choices. In this light, we examine the main steps in data-driven decision-making.
Understand Business Objectives
Identify what the organization aims to achieve. These goals form the basis for analysis. Without clear objectives, data analysis lacks direction. Hence, stakeholders must articulate their strategic goals.
Data Collection
Gather relevant data for analysis. Ensure the sources are credible and data quality is high. This step is vital. Poor data fosters inaccurate analysis, leading to misguided decisions.
Data Cleaning
Prepare the data for analysis. This involves filtering out errors and inconsistencies. It's a laborious but essential process. Clean data ensures reliability of the analysis.
Choose Appropriate Tools and Techniques
Select suitable analytical tools. Consider software that matches the data's complexity. Likewise, apply the right techniques to uncover patterns and trends. Selection is critical to effective analysis.
Data Analysis
Analyze the processed data. Interpret data patterns and trends. Analysts look for insights relevant to the business objectives. This needs expertise in statistical and analytical methods.
Exploratory Data Analysis (EDA)
EDA involves looking at the data without preconceived hypotheses. It helps in understanding data structures and anomalies. This phase is exploratory and open-ended.
Statistical Analysis
Use statistical methods to test hypotheses. It seeks to explain patterns through mathematical models. This provides a quantitative basis for decisions.
Insight Generation
Extract insights from the analysis. Insights should align with business goals. They should be clear, actionable, and directly informative of decision-making processes.
Strategic Decision-Making
Leverage insights for strategy formulation. Decision-makers consider these insights in the context of their goals. This leads to data-informed strategies.
Implementation
Put chosen strategies into action. Monitor the implementation stage carefully. Efficient data analysis informs resource allocation and strategic pivots.
Review and Adapt
Analyze outcomes of implemented strategies. Compare actual results against expected outcomes. This review feeds back into future decision-making cycles. It ensures organizations learn and adapt.
Data analysis for strategic decision-making demands rigor. Each step is fundamental in crafting effective strategies. Ensuring precision at each phase builds confidence in data-driven decisions. This process becomes a loop that refines itself with each iteration. Organizations thrive when they commit to this analytical diligence.
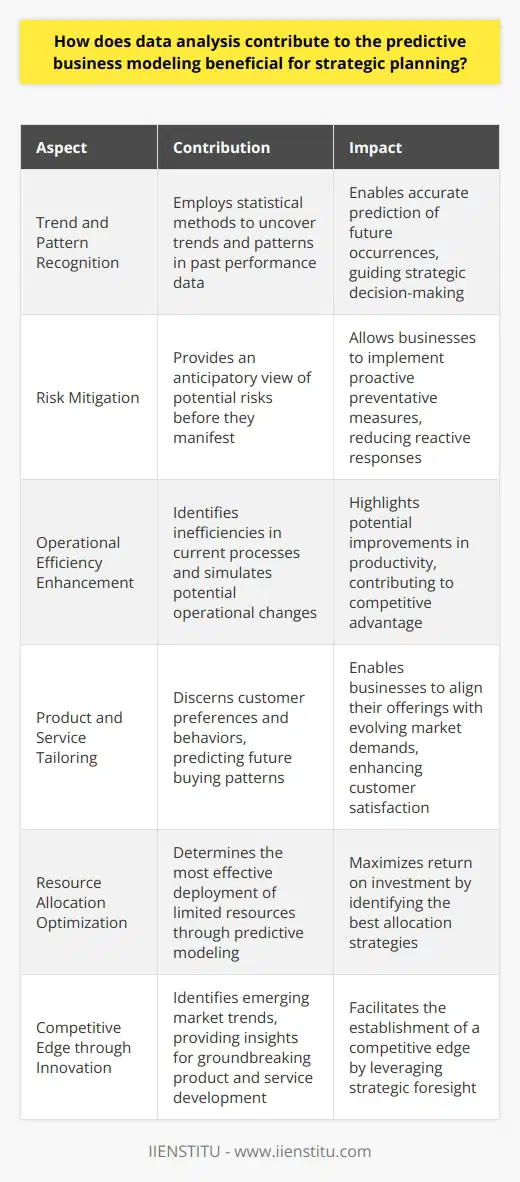
How does data analysis contribute to the predictive business modeling beneficial for strategic planning?
Data Analysis: A Cornerstone of Predictive Business Modeling
Imperative for Informed Decision-Making
Data analysis underpins strategic planning. It transforms raw data into insights. These insights guide business decisions. Predictive business modeling hinges on accurate data analysis. This modeling forecasts future trends and behaviors. It supports strategic decision-making with evidence.
Understanding Trends and Patterns
Data analysis uncovers trends and patterns. These insights reveal past performance indicators. Businesses understand factors influencing their operations. Analysis employs statistical methods for pattern recognition. This enables prediction of future occurrences with greater accuracy.
Risk Mitigation through Predictive Insight
Strategic planning entails assessing potential risks. Data analysis provides an anticipatory view. It uncovers potential risks before they manifest. This foresight allows businesses to implement preventative measures. Risk mitigation becomes proactive, not reactive.
Enhancing Operational Efficiency
Efficient operations stand at the heart of competitive advantage. Data analysis identifies inefficiencies in current processes. This information is vital for predictive business modeling. Models can simulate potential operational changes. They highlight potential improvements in productivity.
Tailoring Products and Services
Understanding customer needs is crucial. Data analysis discerns customer preferences and behaviors. Predictive models use this information. They predict future buying patterns. This enables businesses to tailor products and services accordingly. It ensures alignment with evolving market demands.
Resource Allocation Optimization
Resources are always limited. Data analysis determines the best use of these resources. Predictive modeling simulates various allocation strategies. It identifies the most effective deployment of resources. This maximizes return on investment.
Competitive Advantage through Strategic Foresight
Innovation keeps businesses ahead of the competition. Predictive modeling provides insights for innovation. It identifies emerging market trends. Businesses leverage this for creating groundbreaking products and services. This facilitates the establishment of a competitive edge.
Conclusion
Data analysis is foundational for predictive business modeling. It ensures business strategies are data-driven. Decision-making becomes robust and future-focused. The integration of data analysis in strategic planning is not just beneficial. It is imperative for sustained business success.
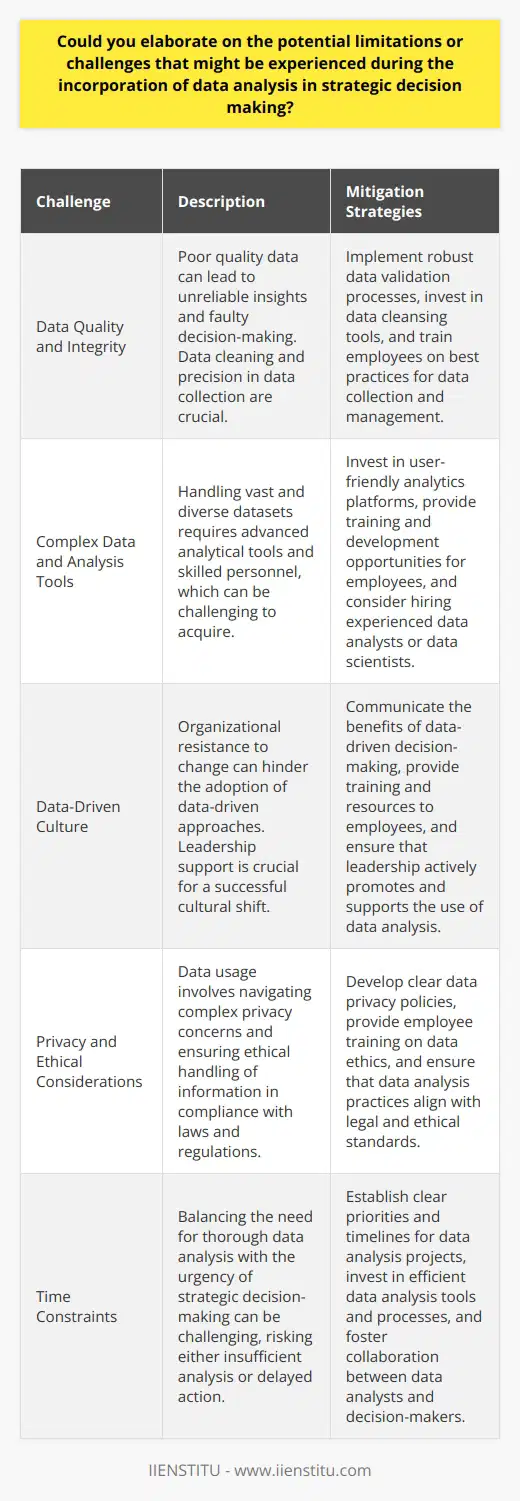
Could you elaborate on the potential limitations or challenges that might be experienced during the incorporation of data analysis in strategic decision making?
Data Analysis in Strategic Decision Making
Strategic decision making often integrates data analysis to drive informed decisions. Yet, this approach can face numerous challenges.
Understanding the Data
One must understand the data's context. Without this, analysis will not inform correctly. Misinterpretation can lead to faulty decisions. Thus, context proves critical in data analysis.
Data Quality and Integrity
Data quality often poses a major hurdle. Poor quality data provides unreliable insights. Data cleaning becomes a necessity. However, it consumes considerable time and resources.
Precision in data collection is paramount. Errors during this phase can lead to inaccurate analyses. Consequently, strategic decisions based on these may be flawed.
Complex Data and Analysis Tools
Another challenge lies with data complexity. Handling vast, diverse datasets requires robust methods. Complexity sometimes overwhelms traditional analytical tools. Hence, analysts must employ advanced technologies.
These advanced tools necessitate skilled personnel. It is not easy to find such experts. Training current employees is an alternative. Still, it demands time and investment.
Data-Driven Culture
Organizational culture may not always align with data-driven approaches. Resistance to change can hinder the implementation. Creating a culture that values data analysis takes significant effort.
Leadership support is crucial in this cultural shift. Without it, adoption of data analysis struggles.
Privacy and Ethical Considerations
Data usage involves privacy concerns. Ethical handling of information is non-negotiable. Companies must navigate these intricate matters with care.
Analysts must comply with laws and regulations. This requirement ensures ethical use of data. Non-compliance risks legal and reputational damage.
Interpretation and Actionable Insights
Even quality analyses require interpretation. Managers must discern actionable insights. This skill does not come naturally to all decision-makers.
Interpreters bridge this gap between data and decisions. They translate analyses into viable strategies. These professionals must possess a keen understanding of both data and business operations.
Integration with Existing Processes
Incorporating data analysis into existing processes poses challenges. Some systems may not accommodate new workflows easily. Adaptation is necessary, yet it can be disruptive.
Consistency in integration aids in a smoother transition. Training and communication are key. Staff must understand why and how changes occur.
Time Constraints
Strategic decisions often operate on tight schedules. Thorough data analysis requires time. Balancing this need with urgency is difficult.
Quick decisions risk insufficient data analysis. Conversely, extensive analysis may delay action. Finding the right balance is thus essential.
Keeping Pace with Technological Advancements
The field of data analysis evolves continuously. New technologies and methods emerge regularly. Staying current is demanding yet vital.
Outdated tools and techniques can cause a competitive disadvantage. Companies must invest in continued learning and upgrades. This ensures that data analysis stays relevant and powerful.
Data Volume
Finally, the sheer volume of data presents its own challenges. Sifting through massive datasets is daunting. It demands powerful computational resources and skilled data scientists.
Data overload can lead to analysis paralysis. Analysts must identify relevant data points. Focusing on key information is crucial for effective decision-making.
In conclusion, integrating data analysis into strategic decision making comes with significant limitations and challenges. Understanding the context, ensuring data quality, mastering complex tools, fostering a data-driven culture, adhering to privacy and ethical standards, drawing actionable insights, streamlining integration, managing time constraints, staying technologically updated, and managing data volume are all vital considerations. Failure to address these challenges can undermine the benefits of data analysis, but with careful management, data can be a powerful tool for strategic decision making.