Pareto Analysis is a powerful problem-solving tool and process improvement technique that helps businesses and organizations identify the most significant problems and prioritize their efforts for maximum impact. This academic blog post will explore the meaning, application, and benefits of Pareto Analysis and delve into various examples and case studies from different industries. As a result, organizations can achieve more efficient and effective outcomes by leveraging the Pareto Principle, also known as the 80/20 rule or Pareto's Rule.
Understanding Pareto Analysis and the Pareto Principle
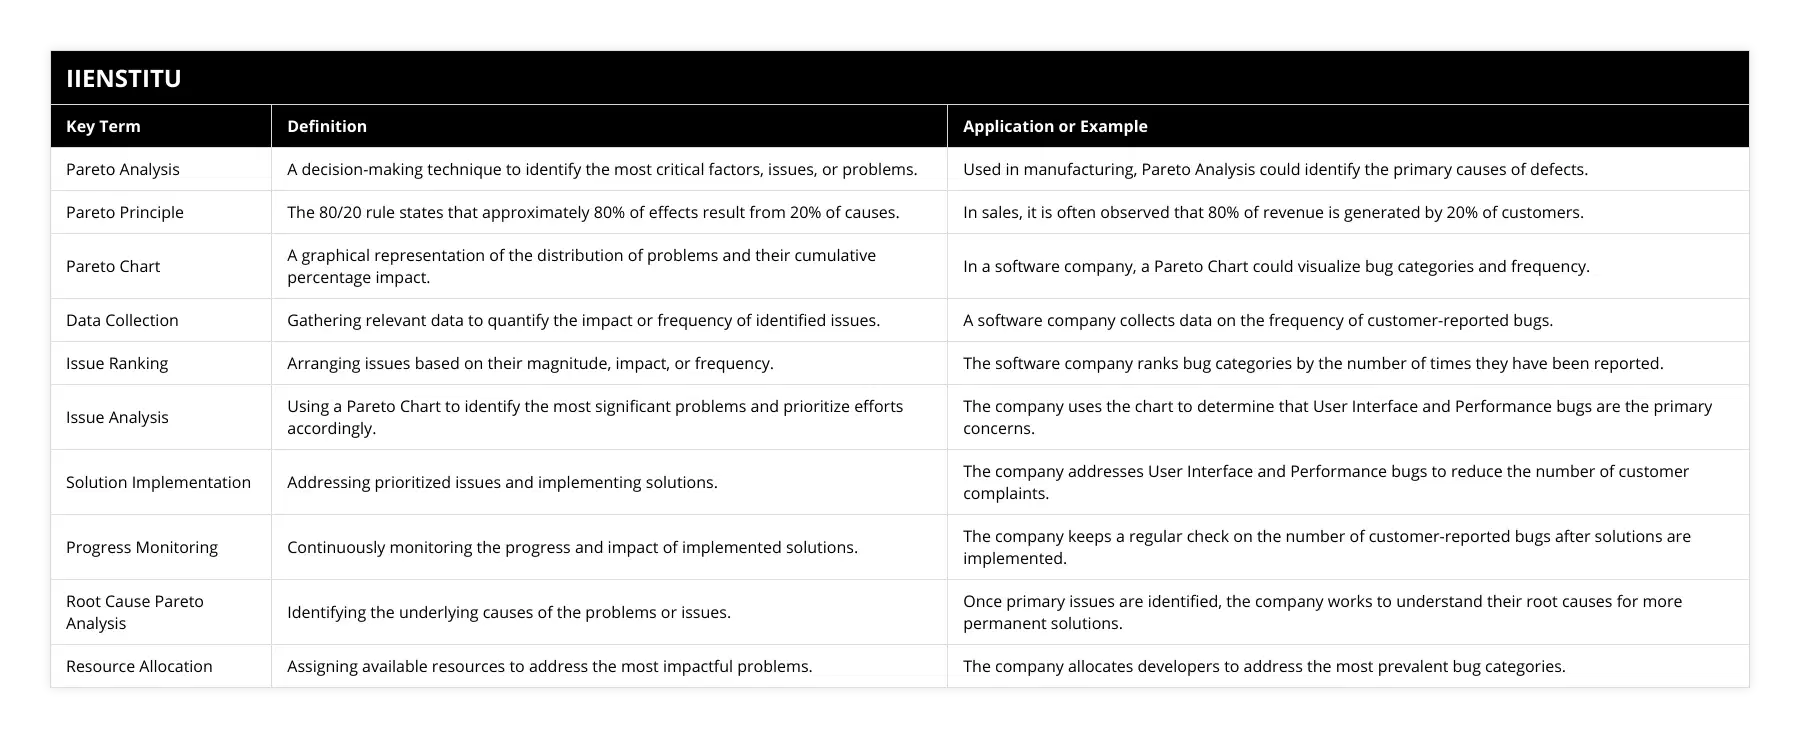
Pareto Analysis Definition: Pareto Analysis is a decision-making technique to identify the most critical factors, issues, or problems. This method involves the application of the Pareto Principle, which states that approximately 80% of effects result from 20% of causes.
Pareto Principle: The 80/20 Rule
The Pareto Principle, or the 80/20 rule, was first introduced by Italian economist Vilfredo Pareto in the early 20th century. The principle emphasizes that a small number of inputs (20%) contribute to a large percentage (80%) of outcomes. In problem-solving, this translates to the idea that focusing on the most significant problems first can lead to significant improvements.
Pareto Analysis Meaning and Purpose
Pareto Analysis prioritizes issues, identifies root causes, and allocates resources efficiently. As a result, organizations can substantially improve with limited resources by focusing on the most significant problems, making Pareto Analysis a valuable tool for continuous process improvement.
The Process of Conducting Pareto Analysis
Pareto Chart Analysis: Pareto Analysis often uses a Pareto Chart, a graphical representation of the distribution of problems, causes, or issues. A Pareto Chart consists of a bar chart and a line graph, with the bars representing the frequency or magnitude of problems and the line indicating the cumulative percentage.
Pareto Analysis Steps
Identify the problems or issues: Begin by compiling a comprehensive list of the issues that must be addressed.
Collect data and categorize: Gather relevant data on the problems, then categorize and quantify them based on their impact or frequency.
Rank the issues: Rank the problems in descending order based on their magnitude, impact, or frequency.
Create the Pareto Chart: Plot the data on a Pareto Chart, illustrating the distribution and cumulative percentage of the issues.
Analyze and prioritize: Use the Pareto Chart to identify the most significant problems and prioritize your efforts accordingly.
Implement solutions and monitor progress: Address the prioritized issues, implement solutions, and continuously monitor the progress and impact of these efforts.
Pareto Analysis Examples and Case Studies
Pareto Analysis Example in Manufacturing: In a manufacturing setting, Pareto Analysis can identify the root causes of defects or issues in the production process. By collecting data on the frequency and impact of each deficiency, a Pareto Chart can be created to visualize the distribution of problems. Focusing on the top 20% of issues, which typically contribute to 80% of the overall defects, allows the organization to prioritize and allocate resources effectively.
Example of a Pareto Chart Analysis (Table):
Imagine a software company is experiencing a high number of customer-reported bugs. They collect data on the frequency of each bug category and create the following table:
In this example, the software company can see that User Interface and Performance bugs account for 62.5% of all reported issues. The company can significantly reduce the number of customer-reported bugs by addressing these two categories. The table forms the basis for creating a Pareto Chart, which visually represents the distribution of issues and helps prioritize problem-solving efforts.
Pareto Chart Example with Explanation
Consider a software development company that wants to reduce the number of customer-reported bugs. By collecting data on the frequency of different bug categories, the company can create a Pareto Chart to identify the most significant issues. For example, the chart might reveal that 80% of customer complaints result from 20% of bug categories. By prioritizing these categories and addressing their root causes, the company can significantly improve the customer experience and reduce the overall number of reported issues.
Pareto Law 20/80 in Problem-Solving
The Pareto Law 80/20 concept can be applied to various industries and scenarios in problem-solving. For example, in sales, it is often observed that 80% of revenue is generated by 20% of customers. Therefore, businesses can optimize their sales strategies and achieve better results by focusing on these top customers and understanding their needs and preferences.
Root Cause Pareto Analysis
Root cause Pareto Analysis involves identifying the underlying causes of the most significant problems, as highlighted by the Pareto Chart. By addressing these root causes, organizations can achieve long-term improvements and prevent future issues from arising.
Pareto Analysis Case Study
Consider a healthcare organization experiencing long patient wait times in its emergency department. By conducting a Pareto Analysis, the organization identifies the primary factors contributing to the delays, such as inefficient patient triage and understaffing during peak hours. By focusing on these critical issues and implementing targeted solutions, the organization can significantly reduce wait times and improve patient satisfaction.
Key Takeaways and Best Practices
A. Pareto Analysis Benefits
Prioritization: Pareto Analysis helps organizations prioritize issues and focus on the most significant problems first.
Resource allocation: By concentrating on the top 20% of issues, organizations can allocate resources more efficiently and achieve better results.
Continuous improvement: Pareto Analysis is a valuable tool for ongoing process improvement, as it enables organizations to identify and address problems consistently.
Root cause analysis: Identifying and addressing the root causes of issues ensures long-term improvements and reduces the likelihood of recurring problems.
Best Practices for Conducting Pareto Analysis
Use accurate and reliable data: The quality of your Pareto Analysis depends on the data quality used. Ensure that you collect accurate and reliable data from relevant sources.
Regularly update your analysis: Review your Pareto Analysis to account for changes in your organization, industry, or market.
Involve stakeholders: Ensure stakeholders' perspectives and expertise are considered during the analysis.
Implement and monitor solutions: After prioritizing issues, implement targeted solutions and continuously monitor progress to assess their effectiveness.
Communicate results: Share the findings and insights from your Pareto Analysis with relevant stakeholders to foster a culture of continuous improvement and data-driven decision-making.
Conclusion
Pareto Analysis is a powerful problem-solving and process improvement technique that leverages the Pareto Principle to enable organizations to focus on the most critical issues and achieve significant improvements. By understanding and applying Pareto Analysis, businesses can prioritize their efforts, allocate resources efficiently, and implement data-driven solutions to drive success. Whether in manufacturing, healthcare, or software development, Pareto Analysis offers a valuable and versatile approach to tackling complex problems and achieving meaningful results.

Frequently Asked Questions
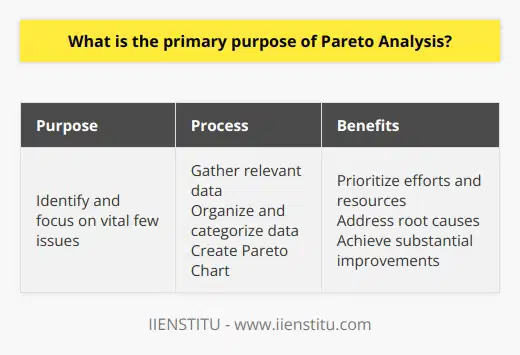
What is the primary purpose of Pareto Analysis?
The primary purpose of Pareto Analysis is to prioritize issues, identify root causes, and allocate resources efficiently by focusing on the most significant problems. This approach helps organizations achieve substantial improvements with limited resources.

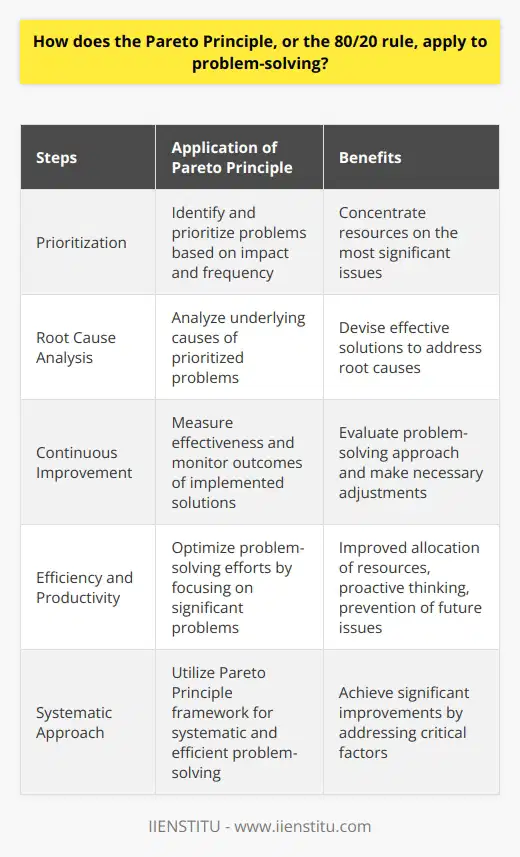
How does the Pareto Principle, or the 80/20 rule, apply to problem-solving?
The Pareto Principle, also known as the 80/20 rule, states that approximately 80% of effects result from 20% of causes. In problem-solving, this translates to the idea that focusing on the most significant problems first can lead to substantial improvements with limited resources.

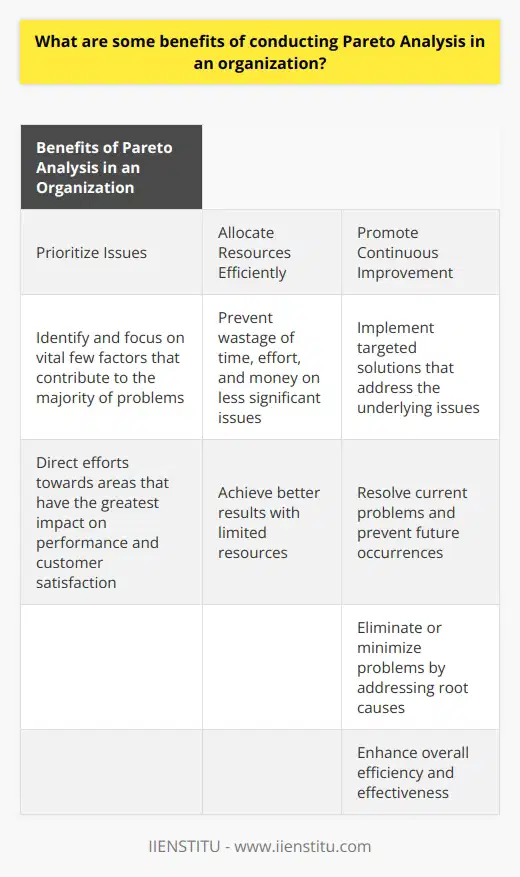
What are some benefits of conducting Pareto Analysis in an organization?
Some benefits of conducting Pareto Analysis include prioritizing issues, enabling efficient resource allocation, promoting continuous improvement, and identifying root causes of problems for long-term improvements and prevention of future issues.


