Understanding intricate concepts and complex issues requires a methodical approach, particularly when the goal is to address problems or innovate solutions collaboratively.
The Affinity Diagram stands as a visual representation that encapsulates this notion, providing an organized, systematic framework for the consolidation and analysis of information gathered from diverse sources.
This blog will delve into the roots and science behind Affinity Diagrams, elucidate the process of their creation, showcase their application across various sectors, and enumerate both their merits and limitations.
Definition of an Affinity Diagram
An Affinity Diagram is a tool used extensively in collaborative settings to organize data into groups based on natural relationships, drawing a consensus on a complex issue that initially seems disordered.
It enables the synthesis of large volumes of data by categorizing ideas into clusters that illustrate the inherent patterns and themes within the collected input.
Purpose and Importance of Using Affinity Diagrams
The primary purpose of an Affinity Diagram is to filter through the cacophony of information and unearth underlying connections that might not be apparent at first glance.
It's invaluable for teams facing a challenging problem or engaging in problem solving training courses, acting as a conduit for structured dialogue and collective understanding.
Overview of Blog's Content
Ishikawa Diagram (Fishbone Diagram): A Comprehensive Guide to Effective Analysis
5S Methodology: A Comprehensive Guide for Process Optimization in Businesses
Nominal Group Technique (NGT): An Efficient Tool for Decision Making
In the subsequent sections, we will explore the origin of the Affinity Diagram, the principles that inform its effective utilization, the methodical steps taken to create one, and the fields in which they are applied.
By the end of this article, the reader will command a comprehensive understanding of Affinity Diagrams and be equipped to apply them in pursuits ranging from business endeavors to educational settings and healthcare initiatives.
History and Origin of the Affinity Diagram
The Contribution of Jiro Kawakita
The legacy of the Affinity Diagram can be traced back to Japanese anthropologist Jiro Kawakita, who developed the tool in the 1960s as a means to synthesize observations and insights from diverse data sources, particularly in cross-cultural settings.
Strategic İmpact Of Quality Function Deployment On Product Design
Practical Techniques İn Descriptive Statistics For Data Analysis
The method, dubbed as the KJ method in his honor, emphasized the importance of categorizing information to distill core themes and patterns.
Adoption and Evolution Over Time
Over the years, the Affinity Diagram has risen to prominence in a sundry of fields, including business and education.
Organizations worldwide leverage the technique to tackle daunting tasks such as strategic planning, product development, and process improvement.
Its evolutionary trajectory has also been marked by its culmination into online certificate courses focused on strategic thought models and complex problem solving.
The Science Behind Affinity Diagrams
Basic Concepts and Terminologies
Explanation for Silent Brainstorming
Silent brainstorming stands as a cornerstone of the Affinity Diagram process. It involves participants independently jotting down their thoughts and ideas, which are then shared anonymously.
This approach circumvents the influence of dominant voices, allowing for a more equitable contribution from all members.
Definition and Examples of Note Cards
Traditionally, ideas and observations are recorded on note cards, a practice that has been adapted for modern uses through digital platforms.
Each card holds a single concept or datum, facilitating the easy manipulation and reorganization of information as the Affinity Diagram is constructed.
Advantages of Grouping
Grouping allows teams to sift through the noise and focus on points of convergence among the collected ideas.
This encourages a shared language and perspective to emerge, aiding in the isolation of themes and patterns.
Explanation of the Psychological Advantages
Flexibility in Thought Process
The method promotes cognitive flexibility by requiring participants to constantly assess and reassess connections between seemingly disparate ideas.
This iterative processing can lead to innovative solutions that may have been overlooked in a more linear or hierarchical framework.
Promotion of Team Engagement
Affinity Diagrams serve not only as a cerebral pursuit but also as a vehicle for fostering team engagement. The participative nature of the tool ensures that each member is actively involved in the crafting of the final diagram.
Reduction of Bias
The collective and anonymous inputs act as a counterbalance to individual biases, yielding a more holistic and unbiased perspective on the subject matter. This fosters a culture of equal representation and diversity of thought.
Steps Involved in Creating an Affinity Diagram
Identifying the Problem or Issue
The genesis of an effective Affinity Diagram lies in the clear articulation of the central challenge or question at hand. This forms the foundation upon which the subsequent steps are built, ensuring that the entire process remains targeted and relevant to the objective.
Brainstorming and Data Collection
Participants engage in a phase of data gathering, where each member contributes their insights in alignment with the identified problem. This collective brain dump is pivotal to enriching the pool of information from which patterns will be drawn.
Sorting and Grouping Related Ideas
The essence of the technique is encapsulated in this step: sifting through individual contributions and arranging them into clusters of related thoughts. This involves an interactive negotiation of the relevance and relationships among the ideas presented.
Labeling and Organizing Groups
Once grouped, the clusters are labeled to reflect the underlying themes of each category. These labels are essential for guiding the analysis and ensuring the information is navigable and interpretable.
Analysing and Interpreting the Results
Analysis of the organized data forms the crux of the process. It's here that insights are distilled and potential solutions or patterns begin to crystallize, offering a roadmap for decision-making or further inquiry.
Application of Affinity Diagrams
Discuss Various Fields Where Affinity Diagrams are Used
In Business
Affinity Diagrams are widely used in business scenarios, from product development brainstorming sessions to addressing customer feedback. They provide a structure within which multifaceted challenges can be deconstructed into actionable insights.
In Education
Educators employ Affinity Diagrams to synthesize complex subject matter, to facilitate group projects, or when developing curricula that require comprehensive understanding from various educational materials.
In Health Care
Healthcare professionals leverage Affinity Diagrams to streamline patient case discussions, to improve care processes, or in developing policies that combine inputs from various stakeholders.
How to Apply Affinity Diagrams in These Fields
The application of an Affinity Diagram follows a uniform process across different fields but is tailored in accordance with the context-specific demands. It begins by delineating a central question, followed by data accumulation, clustering of information, categorization, and culminating in the analysis.
Detailed Examples Illustrating Utilization of Affinity Diagrams
Real-world applications of Affinity Diagrams abound. For instance, in a business setting, they might be used to classify consumer preferences into product feature categories. In education, they could help visualize the interrelation of historical events, while in healthcare, they might map out patient symptoms to potential diagnoses.
Pros and Cons of Using Affinity Diagrams
Advantages of Using Affinity Diagrams
The structure and collaborative nature of Affinity Diagrams enable teams to navigate through complex sets of information and arrive at comprehensive understanding and solutions. They democratize the process of brainstorming, ensuring diverse contributions are heard and valued.
Disadvantages and Potential Challenges of Affinity Diagrams
Challenges include managing the volume of data that can complicate the grouping process, ensuring participation levels remain consistent and high, and the potential of the diagram to manifest existing groupthink if not facilitated with care.
How to Address Potential Limitations
To mitigate limitations, teams can set clear guidelines and limits on contributions, adopt digital tools to manage large data sets efficiently, and ensure a skilled facilitator is in charge of guiding the session to prevent bias or groupthink from overshadowing the exercise.
Recap of the Purpose and Benefits of Affinity Diagrams
Affinity Diagrams serve as a powerful tool for unveiling connections and themes amidst complex ideas, yielding solutions and insights that might have otherwise gone unnoticed. Their importance in problem solving training courses and across various fields of practice cannot be overstated.
The versatility and effectiveness of Affinity Diagrams suggest their applicability is vast. It is an open invitation for professionals across spheres to incorporate this tool into their methodologies for enhanced decision-making and strategic development.
Frequently Asked Questions
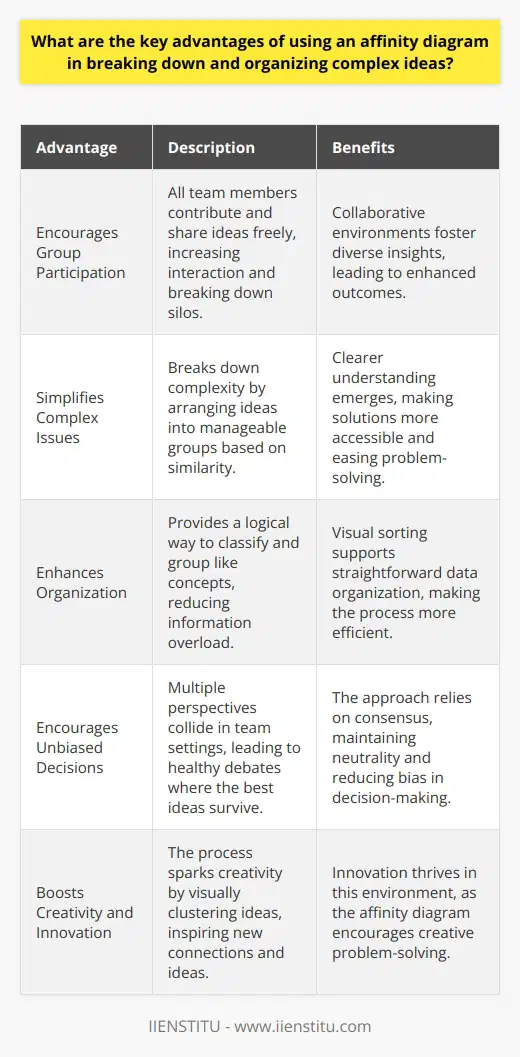
What are the key advantages of using an affinity diagram in breaking down and organizing complex ideas?
What is an Affinity Diagram?
An affinity diagram stands as a tool. It organizes complex data. It helps reveal patterns. Insights emerge readily. It clarifies thoughts. This process occurs in multiple stages. Teams often employ this tool. Complex problems need it. It simplifies understanding.
Key Advantages of Using an Affinity Diagram
Encourages Group Participation
Teamwork enhances outcomes. The affinity diagram enforces this. All team members contribute. They share ideas freely. Interaction increases. Silos break down. Collaborative environments foster. This leads to diverse insights.
Simplifies Complex Issues
It breaks down complexity. Ideas become manageable. They arrange into groups. Similarity guides this process. Clearer understanding emerges. Solutions appear more accessible. It addresses complexity incrementally. This eases problem-solving.
Enhances Organization
Classification becomes straightforward. Data needs organization. The affinity diagram provides it. Grouping like concepts works. It forms categories logically. Information overload decreases. Visual sorting supports it.
Encourages Unbiased Decisions
Bias reduces in team settings. Multiple perspectives collide. Healthy debates arise. The best ideas survive. The approach relies on consensus. Thus, neutrality maintains.
Saves Time
Speed is crucial. This tool helps. Ideas collect quickly. Grouping follows. It avoids prolonged discussions. This saves valuable time. Decisions happen faster. Efficiency ensues.
Boosts Creativity
Ideas generate more ideas. The process sparks creativity. Visual clustering inspires. New connections form. Innovation thrives here.
Provides a Visual Summary
Humans process visuals faster. The affinity diagram capitalizes on this. It provides a visual summary. Patterns become evident. Complex ideas translate into simple groups.
Facilitates Better Communication
Clear communication is key. The process fosters it. It creates a shared understanding. Teams align easily. Goals appear attainable. Everyone sees the big picture. Misunderstandings reduce.
Flexible and Adaptable
Flexibility matters. Situations vary. The affinity diagram adapts. It suits various issues. Any team can use it. It modifies to fit needs. Adaptable tools are valuable.
An affinity diagram offers clear advantages. It organizes and simplifies. Group participation grows. It encourages creativity. Unbiased decisions follow.
Time savings emerge. Communication improves. It remains flexible. Complex ideas need such a tool. They demand effective management. This diagram provides it.

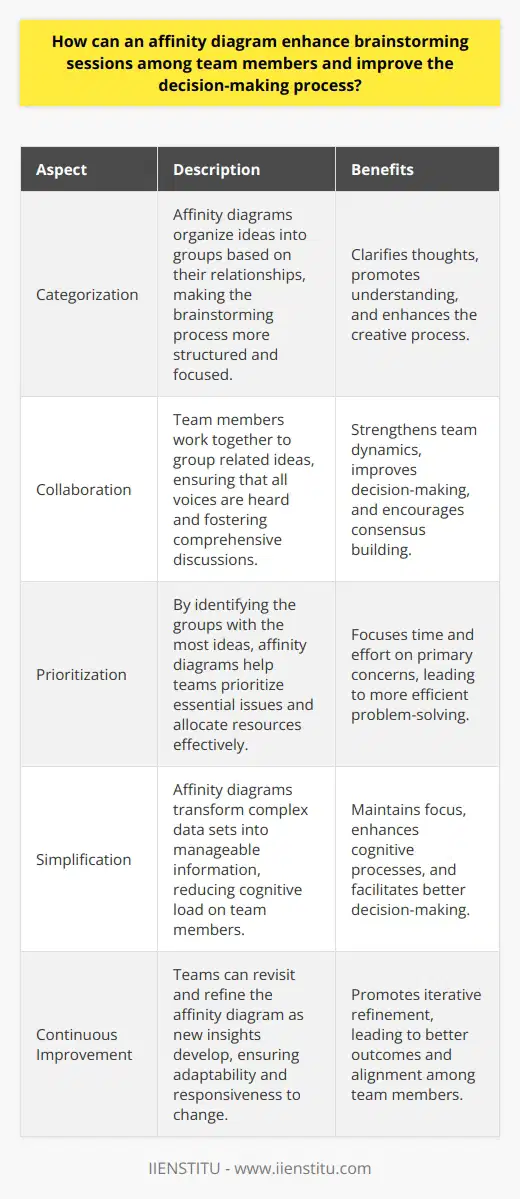
How can an affinity diagram enhance brainstorming sessions among team members and improve the decision-making process?
Affinity Diagrams and Brainstorming
Affinity diagrams serve as powerful tools. They enhance brainstorming among team members. These diagrams categorize ideas into groups. This organization clarifies thoughts and promotes understanding. Brainstorming sessions thus become more structured. The creative process benefits greatly.
An affinity diagram starts with individual ideas. Team members contribute thoughts freely. These ideas are then each written on notes, such as sticky notes. The intention is to generate a wide array of ideas. With ample contributions, diversity in concepts emerges. This phase aligns with basic brainstorming principles.
Enhancing Team Collaboration
Affinity diagrams require collaboration. Team members work together. They group related ideas during the session. Grouping is a collaborative decision-making process. It ensures that all voices get heard. This inclusive approach strengthens team dynamics. It fosters more comprehensive discussions. Teams bond over shared tasks.
Improving Decision-Making Clarity
Through grouping, clarity improves. It becomes easier to identify patterns. Teams can see the "big picture". Diverse viewpoints turn into collective insights. They guide the decision-making process. This clarity reduces confusion. It minimizes the risks of overlooking key elements. Informed decisions follow naturally.
Facilitating Prioritization
Affinity diagrams aid in prioritization. Essential issues stand out. These are the groups with the most ideas. Less critical items assume a secondary focus. Teams thus allocate resources effectively. Time and effort concentrate on primary concerns. Priority setting is vital for efficiency.
Encouraging Consensus Building
The methodology seeks consensus. Teams discuss and agree on idea groups. This agreement is crucial for forward momentum. When consensus exists, teams move with unified intent. That unity streamlines the path from brainstorming to implementation.
Accelerating Problem Solving
Shorter discussion times result.
Groups act as a starting point for solutions.
Actions target grouped themes, not disparate ideas.
Problem-solving becomes more targeted and efficient.
Reducing Information Overload
An affinity diagram simplifies complex data sets. It transforms overwhelming brainstorming outputs. Teams manage information better. This simplicity helps maintain focus. It reduces the cognitive load on team members. This reduction enhances cognitive processes.
Supporting Continuous Improvement
Affinity diagrams encourage iterative refinement. Teams revisit and re-evaluate groupings. They refine the diagram as new insights develop.
Continuous improvement is integral to decision-making. It ensures adaptability and responsiveness to change.
In conclusion, affinity diagrams play a significant role. They add structure and efficiency to brainstorming. They guide teams toward more effective decision-making.
Incorporating them into group sessions promises better outcomes. Teams achieve greater understanding and alignment. Thus, affinity diagrams are not just tools but facilitators of success.

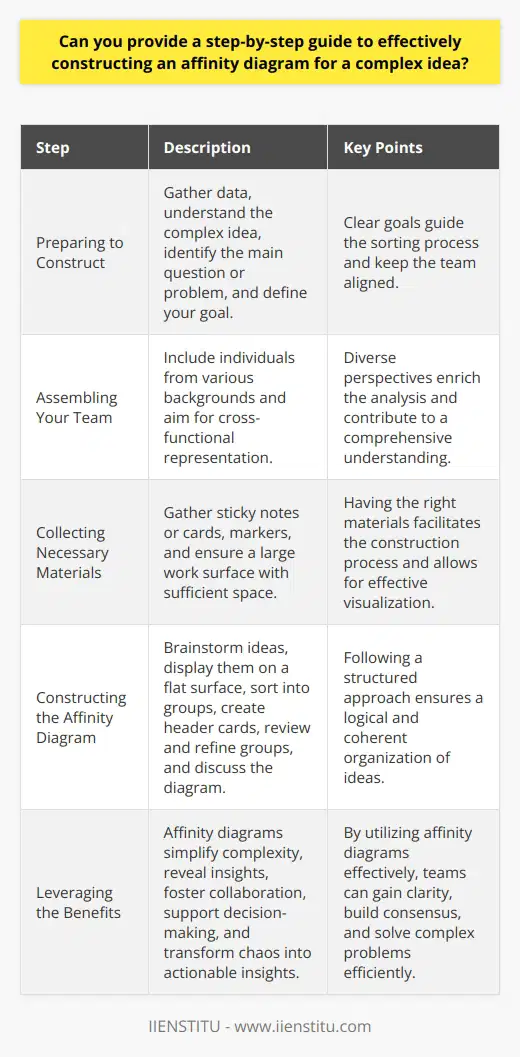
Can you provide a step-by-step guide to effectively constructing an affinity diagram for a complex idea?
Understanding Affinity Diagrams
An affinity diagram organizes a large number of ideas. It uncovers common themes. Complex problems often require such visual sorting. It aids in grouping and understanding information.
Preparing to Construct an Affinity Diagram
First, gather your data. This involves brainstorming or collecting feedback. Ensure you have a clear understanding of the complex idea. Identify your main question or problem.
Define Your Goal
With clear goals, you can focus your effort. They guide your sorting process. Goals keep your team aligned.
Assemble Your Team
Diverse perspectives enrich the analysis. Include individuals from various backgrounds. Aim for cross-functional representation if possible.
Collect Necessary Materials
You will need sticky notes or cards. Markers and a large work surface are essential. Ensure you have sufficient space to display categories.
Constructing the Affinity Diagram
Now, dive into the construction phase. Follow these detailed steps for effectiveness.
Brainstorm Ideas
Write down all ideas on sticky notes. One idea per note works best. Encourage freethinking and creativity.
Display the Ideas
Stick the notes onto a flat surface. Make them all visible. The wall or a large table can serve as your canvas.
Sort into Groups
Look for ideas that seem related. Cluster them nearby. Themes will start to emerge naturally.
Create Header Cards
After grouping, identify the theme of each cluster. Write these on larger header cards. Place them above the respective groups.
Review and Refine Groups
Check for misplaced or solitary ideas. Move notes as needed. Aim for coherent groupings.
Discuss the Diagram
Engage the team in discussion. Validate the groups together. Ensure consensus and shared understanding.
Define Action Items
Decide on next steps. Each theme should lead to action. Assign tasks to team members.
Document the Affinity Diagram
Take a picture or create a digital version. Maintain a record for future reference.
Benefits of an Affinity Diagram
Affinity diagrams simplify complexity. They reveal insights into large, unstructured data. They foster team collaboration and consensus-building. Use them to clarify your thought processes. They support decision-making and problem-solving.
Affinity diagrams are powerful for organizing thoughts. They transform chaos into actionable insight. Follow this guide to leverage their full potential.


