An effective project manager commands the orchestration of time, resources, and personnel, akin to a maestro leading a symphony. Central to this role is the mastery of project timelines through tools that illuminate the path from initiation to completion. Amongst these, the Gantt chart stands as a cornerstone in the project management discipline.
By detailing the intricacies of these charts, one can unlock a comprehensive understanding of project progress and foster a collaborative environment where each stakeholder understands their role and deadlines. This article offers an in-depth examination and guidance based on the accumulated experience of a seasoned project management expert. Enriched with examples and a commitment to elevating the user's knowledge, it aims to provide a thorough understanding of Gantt charts and their application in contemporary project management.
🔊 Ready for an auditory reading experience? Just click the 'Play' button right below this text and immerse yourself in our captivating audio version. Ideal for those who prefer listening to stories, or for times when you're multitasking. Engage with our content effortlessly - one simple click is all it takes to transform your reading into listening!
Project Management Strategies For Effective Decision Making And Planning
Learning And Development Opportunities For Personal And Professional Growth
Long Tail Keyword Research For Management Principles For Business Success
Defining the Gantt Chart in Project Management: In the sphere of project management, the visual representation of tasks plotted against time is of paramount importance for ensuring efficient workflow and time management. The Gantt chart is a visual depiction of a project schedule— it’s a tool that illustrates the start and finish dates of the various elements and milestones of a project. Its simple yet detailed graphical format makes it a staple in project management arsenals, enabling teams to visualize deadlines and dependencies at a glance.
Importance of Mastering Timelines: Mastering timelines is not merely about adhering to deadlines; it is a strategic competency that enhances overall project performance and stakeholder satisfaction. By establishing a clear roadmap, project managers can preempt potential bottlenecks, optimize resource deployment, and assure timely delivery of project outcomes. Thus, the Gantt chart serves as a navigational aid, directing the project lifecycle with precision and clarity.
Preview of the Gantt Chart Guide Content: The forthcoming discussion delves into the Gantt chart's foundations, illuminates its components, and instructs readers on creating and employing Gantt charts effectively in the context of project planning. It is critical that this information is not simply theoretical but also grounded in practical application and enriched with tangible case studies. By the end, readers can expect a comprehensive Gantt chart guide, fully equipped to implement these tools with confidence.
Gantt Chart: A Comprehensive Guide to Effective Project Management
Critical Chain Project Management: Enhancing Efficiency in Task Execution
The Origins and Evolution of the Gantt Chart
Brief History of the Gantt Chart: The inception of the Gantt chart is attributed to Karol Adamiecki, who developed a harmonogram in the late 19th century. However, it was Henry Gantt's adaptation in the early 20th century that refined the tool and lent it his name. Initially employed in industrial manufacturing, the Gantt chart's versatility has allowed its principles to span industries, heralding the universal language of project management timelines.
Modern Adaptations in Project Management: In today's project-driven work climate, Gantt charts have metamorphosed with the advent of digital tools and software, allowing for real-time updates and dynamic interactions. This evolution has suited the fluidity of modern project environments, which demand both agility and precision from project planning processes.
Significance in Contemporary Project Planning: The practicality of Gantt charts in simplifying complex information makes it a timeless tool. It is particularly poignant in our contemporary landscape, where teams are often distributed across geographies and time zones. The clarity provided by a well-constructed Gantt chart transcends these challenges, fostering unity and coordinated action.
Understanding the Components of a Gantt Chart
Explanation of Key Terminology: To fully harness the capabilities of a Gantt chart, one must be conversant with its lexicon — tasks, milestones, dependencies, and resources. Each term delineates specific components and their role within the project's tableau. A task represents a fundamental unit of work, a milestone marks significant progress points, dependencies illustrate task relationships, and resources signify the necessary inputs to execute tasks.
The Role of Tasks, Durations, and Milestones: Tasks are the engines of the Gantt chart, each with a defined duration and crucial in driving the project's momentum. The chart embodies these tasks within bars, demonstrating not only when the tasks begin and end but also how they overlap and interrelate. Milestones punctuate these tasks as checkpoints that inform everyone involved about the completion of critical project stages.
Interpreting Dependencies and Resource Allocation: The interpretation of a Gantt chart extends beyond mere task tracking; it encapsulates the analysis of task dependencies, revealing the natural sequence of activities and identifying potential risk points in the workflow. Coupled with an assessment of resource allocation, project managers can foresee crunch periods and reallocate resources proactively to ensure steadfast progress.
The Art of Creating a Gantt Chart
Step-by-Step Guide to Building a Gantt Chart: Creating an effective Gantt chart necessitates meticulous planning and organization. Starting with defining the project's scope and work breakdown structure, the project manager needs to determine tasks, assign durations, and identify dependencies. These elements are then configured into a sequential visual flow, usually facilitated by specialized software.
Selecting the Right Tools and Software for Gantt Chart Creation: A profound aspect of creating a robust Gantt chart is the selection of appropriate software. The market offers a multitude of tools, each with a slew of features. The discerning project manager must weigh options based on usability, scalability, and integrations with other project management systems.
Common Pitfalls and How to Avoid Them: There exists a plethora of traps that can ensnare the unwary chart creator — from an overloaded chart replete with excessive detail to a sparse chart that omits critical dependencies. To avoid these, one should balance granularity with clarity and confirm that the chart remains a functional tool and not just an elaborate visual.
Strategic Implementation of Gantt Charts in Project Planning
Integrating Gantt Charts into Project Management Workflows: The incorporation of Gantt charts into project management is more than just a display of timelines; it is a strategic alignment of project vision with operational reality. By embedding Gantt charts into regular project reviews and updates, teams can align their rhythm with the planned schedule, flagging and addressing discrepancies as they arise.
Enhancing Communication with Gantt Charts: A well-conceived Gantt chart transcends the role of a planning tool, becoming a powerful communication medium. It blends visual appeal with informative richness, creating common ground for stakeholders to engage, collaborate, and resolve issues rooted in project scheduling.
Case Study: Successful Gantt Chart Usage in a Major Project
To underscore the value of Gantt charts in real-world scenarios, consider the case of a major construction project that employed a Gantt chart to coordinate the efforts of multiple subcontractors. The project's timeline visibility allowed for astute resource management and timely risk mitigation, culminating in a project delivered on time and within budget.
Mastering Timelines with Advanced Gantt Chart Techniques
Adaptive Project Management with Gantt Charts: Advanced Gantt chart usage involves adaptive project management techniques, accommodating changes and remaining responsive to the evolving project environment. This dynamic approach permits the Gantt chart to function as a living document, evolving in conjunction with project progress.
Leveraging Critical Path Method (CPM) within Gantt Charts: Utilizing the Critical Path Method (CPM) within Gantt charts is a strategic maneuver to identify the sequence of crucial tasks that determine the project's minimum duration. This method illuminates the path with the least scheduling flexibility, a vital insight that aids in avoiding project overruns.
Utilizing Gantt Charts for Risk Assessment and Management: Incorporating risk management components into Gantt chart planning allows for a preemptive stance on potential project impediments. By layering risk analysis over timelines, project managers can allocate additional buffers or resources to high-risk tasks, thereby shielding the project from unexpected setbacks.
Gantt Chart Software and Tools: A Comparative Analysis
Overview of Popular Gantt Chart Software: An exploration of Gantt chart software reveals a landscape of options ranging from established entities such as Microsoft Project to newer players offering cloud-based collaboration. To further this understanding, a comparative analysis delves into distinguishing features, user interfaces, and capacity for integration with other project tools.
Features and Capabilities to Look For: Selecting Gantt chart software demands scrutiny of its features and capabilities. Essential elements like drag-and-drop functionality, critical path visibility, and customization options are pivotal. Moreover, the ability to scale and accommodate various project sizes is a crucial feature.
Tailoring Software Choices to Project Needs: The heterogeneity of projects necessitates software choices attuned to specific project requirements. While some endeavors may benefit from intricate dependency tracking, others might prioritize communication and reporting features. The art lies in aligning software functionalities with the nuances of the project.
Addressing Common Questions and Misconceptions
Resolving Frequent Challenges Faced by Beginners: Emerging project managers often encounter challenges with Gantt charts, from underestimating the time needed for task completion to overlooking the complexity of dependencies. This section aims to offer practical advice on resolution strategies, ensuring acclimation to Gantt chart utilization.
Debunking Myths Surrounding Gantt Charts: Prevalent myths often cast Gantt charts as overly rigid or suitable only for large-scale projects. Addressing such misconceptions is essential to encouraging wider adoption and innovation within project management practices. A nuanced clarification can empower teams to harness this tool's true potential.
Expert Tips for Achieving Gantt Chart Proficiency: Attaining Gantt chart proficiency is a culmination of understanding principles, practical experience, and continuous learning. Recommendations may encompass engaging in problem solving skills training or enrolling in online certificate courses to deepen one's knowledge. These avenues provide a solid foundation for mastering Gantt chart mechanics.
Future Trends and Innovation in Gantt Chart Methodology
Predictions on the Evolution of Gantt Charts: Anticipating future trends, it is plausible that Gantt charts will experience further advancements, incorporating artificial intelligence and machine learning to enhance predictive planning and automation. These innovations promise to refine the accuracy and utility of Gantt charts in adaptive project management practices.
Emerging Technologies Impacting Gantt Chart Utility: Blockchain and real-time collaboration platforms present emerging technologies with a potential impact on the utility of Gantt charts. As these tools merge with project management software, they may bring about a new era of transparency and accountability in managing project timelines.
Staying Ahead: Continuous Learning in Project Management: The field of project management is not static, and neither should be the project manager's approach to professional growth. As methodologies evolve, the commitment to continuous learning and staying abreast of the latest developments is paramount in remaining effective and responsive to the demands of the discipline.
Conclusion
Recap of Gantt Chart Essentials and Their Impact on Project Success: In summary, this guide has traversed the fundamental aspects of Gantt charts, their construct, and their profound impact on project outcomes. By comprehending the essentials and integrating these tools into everyday project planning, managers can elevate their projects' success rates and ensure more predictable deliveries.
Encouragement for Practicing Gantt Chart Skills: It cannot be overstated that proficiency with Gantt charts, much like any skill, requires practice and diligence. This guide encourages readers to apply the knowledge imparted, experiment with various techniques, and continually refine their charting capabilities.
Invitation to Share Success Stories and Feedback: In the pursuit of knowledge-sharing and community building, readers are invited to share their success stories and provide feedback on the guide's content. Such an exchange not only fosters a culture of collective improvement but also deepens the understanding and application of Gantt chart principles.
Frequently Asked Questions
What are the key elements to include in a Gantt Chart for effective project management?
Understanding Gantt Charts
Gantt charts are vital tools for project management. They help teams visualize project timelines and activities. For a Gantt chart to be effective, it must contain key elements.
Essential Components of a Gantt Chart
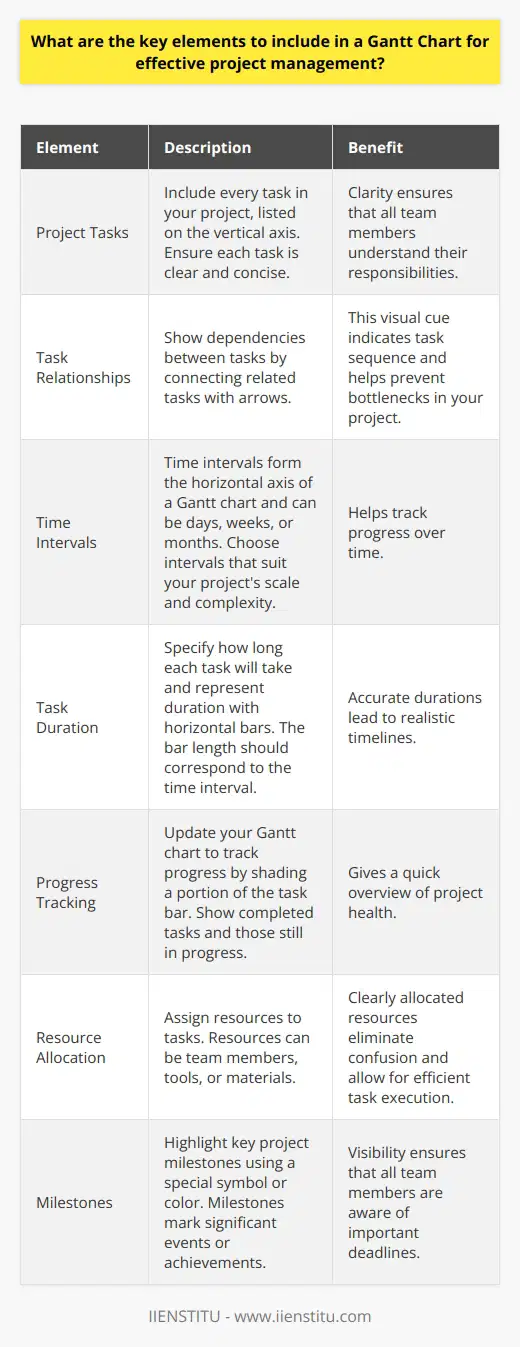
Project Tasks
Include every task in your project. List them on the vertical axis. Make sure each task is clear and concise. This clarity ensures that all team members understand their responsibilities.
Task Relationships
Show dependencies between tasks. Connect related tasks with arrows. This visual cue indicates task sequence. It helps prevent bottlenecks in your project.
Time Intervals
Time intervals form the horizontal axis of a Gantt chart. They can be days, weeks, or months. Choose intervals that suit your project's scale and complexity. This helps track progress over time.
Task Duration
Specify how long each task will take. Represent duration with horizontal bars. The bar length should correspond to the time interval. Accurate durations lead to realistic timelines.
Start and End Dates
Identify when each task will begin and end. These dates provide concrete time frames for the team. Precise dates set expectations and foster accountability.
Progress Tracking
Update your Gantt chart to track progress. This can involve shading a portion of the task bar. Show completed tasks and those still in progress. This gives a quick overview of project health.
Resource Allocation
Assign resources to tasks. Resources can be team members, tools, or materials. Clearly allocated resources eliminate confusion. They allow for efficient task execution.
Milestones
Highlight key project milestones. Use a special symbol or color. Milestones mark significant events or achievements. Their visibility ensures that all team members are aware of important deadlines.
Implementing a Gantt Chart
Use software tools to create your Gantt chart. Digital tools offer flexibility and ease of updating. Train your team to read and interpret this chart. Regularly review and adjust your Gantt chart. Ensure it reflects changes in your project. Maintain open communication about the chart's status. This transparency encourages team engagement.
By including these key elements, your Gantt chart becomes a robust project management tool. It can guide your team through the complexities of project work. It turns intricate plans into clear, manageable paths toward success.
How does a Gantt Chart assist in predicting and managing potential challenges in project timelines?
Understanding Gantt Charts
Gantt Charts are visual tools. They show project schedules. These charts display tasks over time. Gantt Charts help project managers. They are essential for planning. They also assist in tracking project progress.
Gantt Charts and Challenge Prediction
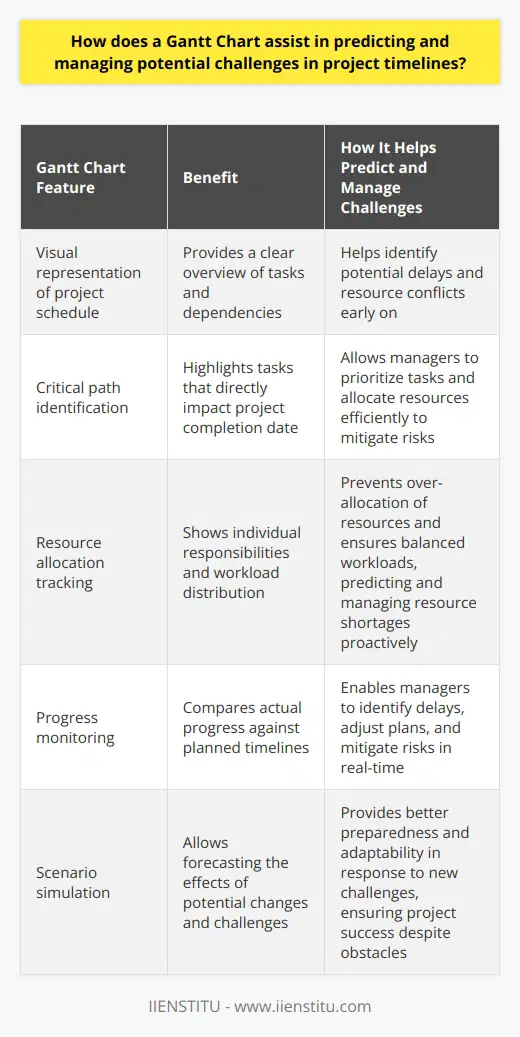
Predicting challenges is key for project success. Gantt Charts aid in this prediction. They show task durations. They also demonstrate dependencies. This visualization helps spot potential delays early. Managers can see how tasks interlink. Overlaps become visible. Critical paths emerge.
Critical Path Identification
Every project has a critical path. It comprises tasks that directly affect the finish date. Delays in these tasks can jeopardize project timelines. Gantt Charts highlight the critical path. Managers use these insights. They prioritize tasks and allocate resources efficiently.
Resource Allocation
Gantt Charts display individual responsibilities. They show who is doing what, and when. This clarity prevents over-allocation of resources. It ensures balanced workloads. Managers can predict resource shortages. They can manage work distribution proactively.
Gantt Charts in Managing Challenges
When a project is underway, Gantt Charts track progress. They show actual progress against planned timelines. Managers use them to monitor delays. They can adjust plans and mitigate risks.
Visualizing Delays
When tasks fall behind, Gantt Charts show the impact. This visual cue prompts immediate action. Managers can reallocate resources. They can also revise timelines as necessary.
Adjusting Plans
Flexibility is vital in project management. Gantt Charts provide a visual plan. Managers use them to tweak project schedules. They can make changes in response to new challenges. This adaptability is crucial for project success.
Improving Communication
Communication is essential for managing challenges. Gantt Charts serve as a communication tool. Project teams see the same timeline. Everyone understands the project status. This common understanding fosters better collaboration.
Simulating Scenarios
Gantt Charts enable scenario simulations. Managers can forecast the effects of potential changes. They can see how different challenges might affect the project. This foresight allows for better preparedness.
In summary, Gantt Charts are powerful. They do more than just schedule tasks. They help predict and manage project challenges. This proactive approach is key to project management success. Gantt Charts transform complexity into clarity. They turn potential obstacles into manageable tasks. Use Gantt Charts to navigate project timelines effectively. With them, you can achieve project goals despite challenges.
Can a Gantt Chart adapt to changes in project timelines and how does it ensure the project remains on track?
Gantt Charts and Adaptability
Understanding Gantt Charts
Gantt Charts serve as dynamic tools. They outline projects visually. Each project task appears on a horizontal timeline. The timeline reflects start and finish dates. Dependencies between tasks become clear. This clarity aids in planning and tracking.
Flexibility in Project Management
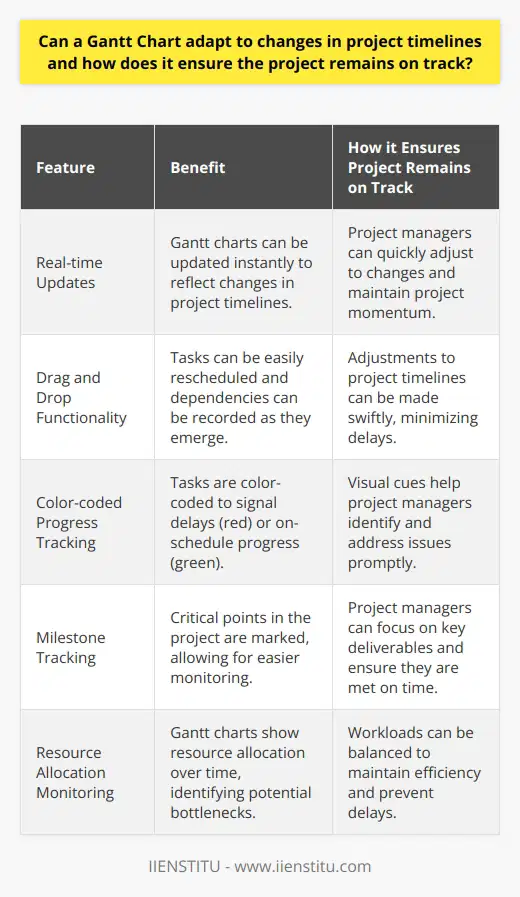
Gantt charts must adapt to changing conditions. They are flexible and efficient. Real-time updates are possible. They reflect changes in project timelines instantly.
Adapting to Changes in Timelines
Track task completions with Gantt charts. Adjust timelines when necessary. Drag and drop functions allow easy adjustments. Extend deadlines when needed. Reschedule tasks quickly. Record new dependencies as they emerge.
Ensuring Projects Remain on Track
Monitor overall project progress. Gantt charts turn colors when tasks fall behind. Red signals delays, green for on-schedule tasks. Milestones mark critical points. These visual cues guide project managers.
- Redefine task sequences to regain time.
- Shift resources to critical tasks.
- Assess the impact of changes instantly.
- Communicate alterations to the team swiftly.
Benefits of Gantt Charts in Dynamic Environments
Track multiple project aspects simultaneously. Acknowledge resource allocation over time. Identify bottlenecks before they cause delays. Balance workloads for efficiency.
Gantt charts offer strategic value. They adapt to project timeline changes. They ensure projects stay on track. Deploy Gantt charts for robust project management. Embrace their adaptability for successful outcomes.